Any commercial craft brewer would say they care about quality (if you’re a craft brewer and disagree with this statement, please let me know so that I can stop drinking your beer).
But let’s dissect that a little. What does your quality assurance scheme achieve? What does it tell you? And what would you like it to tell you?
Even the simplest QA schemes will cover raw ingredients checks, and process automation for steady-state processes such as mashing, boiling, fermentation and conditioning temperatures.
You’ll be adjusting the length of some processes based on measurements, such as extending vorlauf based on wort clarity or extending (or curtailing) fermentation based on gravity.
Then, between each stage in the process, you’ll be doing simple pass/fail checks. Is the liquid clear enough and the correct colour? Does it taste and smell right? Is the gravity good and the pH pukka? In latter stages, does it have the correct level of dissolved O₂ and CO₂?
These checks are vital and tell you whether the process is going wrong – and if so, allow you to dump that batch before it disappoints your hard-won customers.
But, crucially, pass/fail checks don’t tell you how right things are going!
Pass/fail data don’t show you how close to the limit you are. They don’t show trends. They don’t show you how likely you are to be able to brew a consistent quality product again in the future. You gain these benefits only by recording the actual values (for lab data and sensory) over multiple batches, over time. Once you start doing this you can gain some key insights.
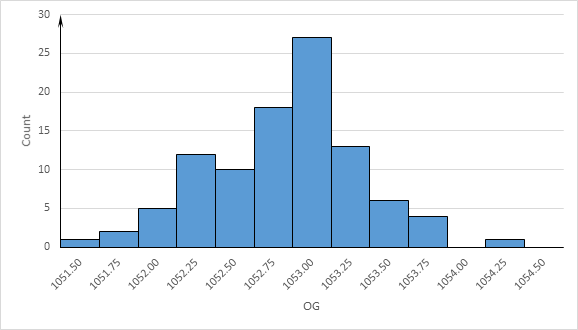
First up, you can view a histogram distribution of data at each stage (see chart below). This tells you how frequent each value is, where the outliers are and where the majority of the values lie.
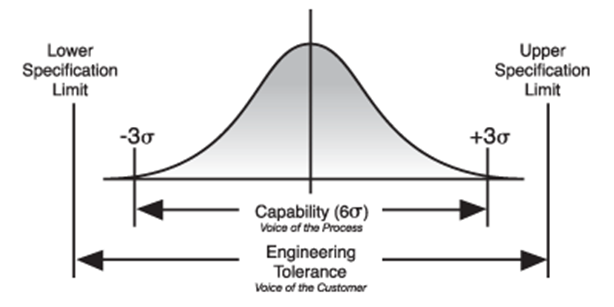
Then, you can start to look at the capability for each check at each step in the process. This allows you to answer what should be a key question for any brewer: “How capable is my production process of producing the right result?”
You can do this separately for each stage: brewhouse, fermentation, conditioning, and packaging. You can even assign a numeric score to capability. In essence, it’s a score of how easily your histogram fits within your specification limits.
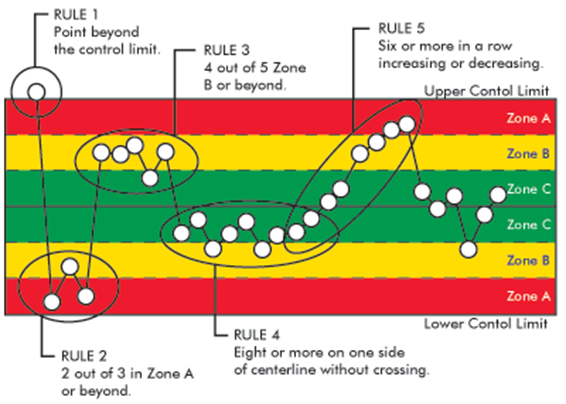
Moving on, you can look at statistically significant trends within your data. If your dissolved O₂ is within acceptable limits but steadily rising over time then you may have an emerging problem in conditioning. Pass/Fail checks won’t show this. If you have a number of OG values near the lower or upper spec limit it might be time to run your own lab check on the malt you’re buying.
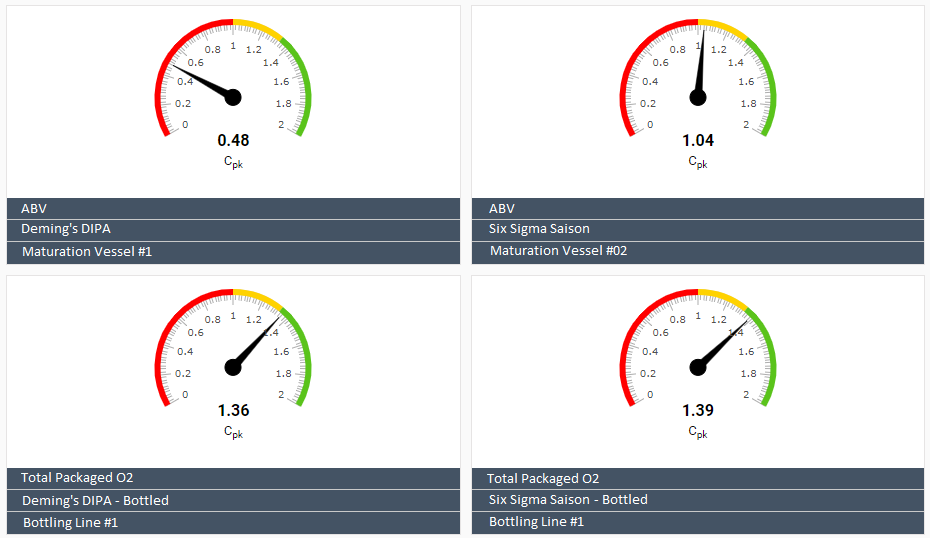
Finally, you could even start to compare quality parameters between different brews. Is the process capability for the ABV of your DIPA a problem, where it’s fine for your Saison?
Managing the amount of data required for this type of analysis on paper or spreadsheets is near impossible.
How Brewers can gain QA wins
Any commercial craft brewer would say they care about quality (if you’re a craft brewer and disagree with this statement, please let me know so that I can stop drinking your beer).
But let’s dissect that a little. What does your quality assurance scheme achieve? What does it tell you? And what would you like it to tell you?
Even the simplest QA schemes will cover raw ingredients checks, and process automation for steady-state processes such as mashing, boiling, fermentation and conditioning temperatures.
You’ll be adjusting the length of some processes based on measurements, such as extending vorlauf based on wort clarity or extending (or curtailing) fermentation based on gravity.
Then, between each stage in the process, you’ll be doing simple pass/fail checks. Is the liquid clear enough and the correct colour? Does it taste and smell right? Is the gravity good and the pH pukka? In latter stages, does it have the correct level of dissolved O₂ and CO₂?
These checks are vital and tell you whether the process is going wrong – and if so, allow you to dump that batch before it disappoints your hard-won customers.
But, crucially, pass/fail checks don’t tell you how right things are going!
Pass/fail data don’t show you how close to the limit you are. They don’t show trends. They don’t show you how likely you are to be able to brew a consistent quality product again in the future. You gain these benefits only by recording the actual values (for lab data and sensory) over multiple batches, over time. Once you start doing this you can gain some key insights.
First up, you can view a histogram distribution of data at each stage (see chart below). This tells you how frequent each value is, where the outliers are and where the majority of the values lie.
Then, you can start to look at the capability for each check at each step in the process. This allows you to answer what should be a key question for any brewer: “How capable is my production process of producing the right result?”
You can do this separately for each stage: brewhouse, fermentation, conditioning, and packaging. You can even assign a numeric score to capability. In essence, it’s a score of how easily your histogram fits within your specification limits.
Moving on, you can look at statistically significant trends within your data. If your dissolved O₂ is within acceptable limits but steadily rising over time then you may have an emerging problem in conditioning. Pass/Fail checks won’t show this. If you have a number of OG values near the lower or upper spec limit it might be time to run your own lab check on the malt you’re buying.
Finally, you could even start to compare quality parameters between different brews. Is the process capability for the ABV of your DIPA a problem, where it’s fine for your Saison?
Managing the amount of data required for this type of analysis on paper or spreadsheets is near impossible.
ARTICLES
Spring Report | Hops
#132 Brewing Sustainably – Where do you start?
Sustainable labelling
Close Brothers Brewery Rentals announce new managing director
PODCASTS